CircuitPythonでMusic Visualizerを作る
English follows Japanese.
Creating a CircuitPython Music Visualizer
MicroPythonのulabライブラリがCircuitPythonにも移植されたそうなので、Adafruit CLUEのマイクから入力された音声をulabの高速フーリエ変換(FFT)を通して視覚化してみました。
I have visualized the sound signal captured from MEMS microphone on the Adafruit CLUE board as the MicroPython ulab library has been ported to CircuitPython.
ハードウェア
Hardware
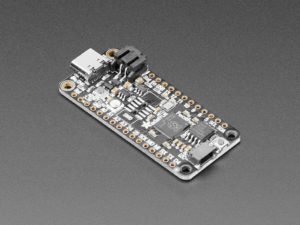
Adafruit CLUE (STEAM Tokyoストアで販売中です!)
ソフトウェア
Software
CircuitPython 5.3.1
CircuitPython library bundle(adafruit-circuitpython-bundle-5.x-mpy-20200818)
仕様
Specifications
- CLUEに搭載されているMEMSマイクからの信号を256サンプル取得しulabの高速フーリエ変換(FFT)をかける
- 計算負荷を減らすため、x軸の周波数の変換は行わない
- FFT後の波形を4サンプルごとに最大値を取得し、それを画面上の点として表示
- 画面表示はdisplayioライブラリのspriteを使用
- 画面の点の色は15段階のグラデーションとする
- The code captures the sound signals from MEMS microphone as a 256 samples. Performs FFT using ulab library.
- Does not calculate X-axis to reduce the computational load.
- Picks max value in every 4 samples and set as a plot
- Utilizes the sprites in displayio library
- 15 colors of plots
sprite用bitmapファイル
Bitmap file for the sprites
28 x 28ピクセルのビットマップファイルです。この7 x 7の領域が1つのスプライトになります。
ファイル名はHeatMap_sprites_7x7.bmpとしています。以下の画像を右クリックしてダウンロードしてください。
The bitmap file named as HeatMap_sprites_7x7.bmp which is 28 x 28 pixels. Single sprite has 7 x 7 pixels. Please download the picture below by right-click and download.
コードとビットマップファイルの保存先
Storing the code and the bitmap file
CircuitPython対応ボードはPCと接続するとUSBメモリとして認識されます。
そのドライブの直下に先程のビットマップファイルと以下のコードをcode.pyとして保存します。
CircuitPython board will be recognized as a USB memory from you PC. Please place the code.py and the bitmap file in the root directory.
コード
The code
CircuitPython 6系をお使いの方はulab.extras.spectrogram を ulab.fft.spectrogramに書き換えてください。
Please replace the code ulab.extras.spectrogram to ulab.fft.spectrogram for CircuitPython 6 or grater.
# CircuitPython Music Visualizer
# Aoyama_PROD, STEAM Tokyo
import array
import board
import audiobusio
import displayio
import adafruit_imageload
import ulab
import simpleio

sr = 16000  # Sampling rate
sample_ct = 256  # Sample count
peak = [31] * 32  # Array to hold the maximum value of the variable pxy
gain_f = 18000  # You can adjust the gain by changing this value
Nyquist = sample_ct / 2 + 1  # Nyquist value

# Display
display = board.DISPLAY

# Load the sprite sheet (Bitmap)
sprite_sheet, palette = adafruit_imageload.load("/HeatMap_sprites_7x7.bmp",
                                                bitmap=displayio.Bitmap,
                                                palette=displayio.Palette)

# Create a sprite (tilegrid)
sprite_hd = displayio.TileGrid(sprite_sheet, pixel_shader=palette,
                               width=32,
                               height=32,
                               tile_width=7,
                               tile_height=7)

# Create a Group to hold the sprite
group_hd = displayio.Group(scale=1)

# Add the sprite to the Group
group_hd.append(sprite_hd)

# Add the Group to the Display
display.show(group_hd)

# Microphone
mic = audiobusio.PDMIn(
    board.MICROPHONE_CLOCK,
    board.MICROPHONE_DATA,
    sample_rate=sr,
    bit_depth=16  # CP supports only 16
)

# A sample from the MEMS microphone
samples = array.array('H', [0] * sample_ct)
mic.record(samples, len(samples))

while True:
    mic.record(samples, len(samples))
    samparray = ulab.array(samples)

    f = ulab.extras.spectrogram(samparray)  # FFT(absolute)

    for i in range(1, Nyquist, 4):  # Discard first 3 values
        fmax4 = max(f[i:i + 3])  # Get max value of every four of f
        # map fmax4 value
        pxy = int(simpleio.map_range(fmax4, 0, gain_f, 31, 0))
        pxx = int((i - 3) / 4)  # x of sprite

        if peak[pxx] > pxy:
            peak[pxx] = pxy  # update the peak array
        elif peak[pxx] < 30:
            peak[pxx] = peak[pxx] + 2  # move pixels down by 2

        # Clear existing sprites
        if peak[pxx] > 0:
            sprite_hd[pxx, peak[pxx] - 1] = 0
        if peak[pxx] > 1:
            sprite_hd[pxx, peak[pxx] - 2] = 0
        # Place sprites
            sprite_hd[pxx, peak[pxx]] = 15 - int(peak[pxx]/2)
コードの解説
Code walkthrough
import array
import board
import audiobusio
import displayio
import adafruit_imageload
import ulab
import simpleio
array — 配列を扱うためのライブラリ
board — CircuitPython対応ボードのピンを扱うためのライブラリ
audiobusio — MEMSマイクからの入力を扱うためのライブラリ
displayio — 画面表示とスプライトのためのライブラリ
adafruit_imageload —ビットマップファイルを読み込むためのライブラリ
ulab — Pythonのnumpyに相当するライブラリ
simpleio — 数値の範囲のマッピングを行うためのmap_rangeを行うために使用
array — handles array
board — enables board-specific pins
audiobusio — handles the input from PDM microphone
displayio — handles the screen and sprites
adafruit_imageload —loads the bitmap file
ulab — numpy-like library
simpleio — imported to use map_range
sr = 16000  # Sampling rate
sample_ct = 256  # Sample count
peak = [31] * 32  # Array to hold the maximum value of the variable pxy
gain_f = 18000  # You can adjust the gain by changing this value
Nyquist = sample_ct / 2 + 1  # Nyquist value
音声サンプルの取得のための初期値を設定します。
サンプリングレートを16kHz、サンプル数を256とします。
変数peakはFFT後のy軸の振幅の周波数帯ごとの最大値を格納します。
変数gain_fは画面の表示上のゲインを設定しています。小さな音量でもビジュアライザの動きを大きくしたい場合はこの値を大きくしてください。
変数Nyquistはナイキスト周波数(サンプルサイズの半分)です。
Set the initial values for audio sample acquisition.
Set the sampling rate to 16 kHz and the number of samples to 256.
The variable peak stores the maximum value for each frequency band of the amplitude of the y-axis after FFT.
The variable gain_f sets the display gain of the screen. If you want to increase the movement of the visualizer even at low volume, increase this value.
The variable Nyquist is a Nyquist frequency (half the sample size).
# Display
display = board.DISPLAY

# Load the sprite sheet (Bitmap)
sprite_sheet, palette = adafruit_imageload.load("/HeatMap_sprites_7x7.bmp",
                                        bitmap=displayio.Bitmap,
                                                palette=displayio.Palette)

# Create a sprite (tilegrid)
sprite_hd = displayio.TileGrid(sprite_sheet, pixel_shader=palette,
                               width=32,
                               height=32,
                               tile_width=7,
                               tile_height=7)

# Create a Group to hold the sprite
group_hd = displayio.Group(scale=1)

# Add the sprite to the Group
group_hd.append(sprite_hd)

# Add the Group to the Display
display.show(group_hd)
displayでAdafruit CLUEのディスプレイのオブジェクトを作成します。
adafruit_imageloadライブラリを使ってビットマップファイルを読み込みます。
読み込んだビットマップファイルからスプライトを作り、スプライトをグループに追加した後グループをディスプレイに表示します。
Create the display object for the Adafruit CLUE display with display.
It uses the adafruit_imageload library to load a bitmap file.
From the imported bitmap file, we create a sprite, add the sprite to a group and then display the group on the display.
# Microphone
mic = audiobusio.PDMIn(
    board.MICROPHONE_CLOCK,
    board.MICROPHONE_DATA,
    sample_rate=sr,
    bit_depth=16  # CP supports only 16
)

# A sample from the MEMS microphone
samples = array.array('H', [0] * sample_ct)
mic.record(samples, len(samples))
MEMSマイクから音声のサンプリングを行います。
We sample audio from the MEMS microphones.
while True:
    mic.record(samples, len(samples))
    samparray = ulab.array(samples)

    f = ulab.extras.spectrogram(samparray)  # FFT(absolute)
ここからメインループです。
MEMSマイクで256サンプルを取得し、ulabのndarrayに変換します。
ndarrayに変換後の音声サンプルに対してFFTを行います。
ulab.extras.spectrogramを使うと、FFTの絶対値を得ることが出来ます。
The main loop from here.
We take 256 samples with the MEMS microphone and convert them to ndarray in ulab.
FFT the audio samples after converting them to ndarray.
You can use ulab.extras.spectrogram to get the absolute value of the FFT.
    for i in range(1, Nyquist, 4):  # Discard first 3 values
        fmax4 = max(f[i:i + 3])  # Get max value of every four of f
        # map fmax4 value
        pxy = int(simpleio.map_range(fmax4, 0, gain_f, 31, 0))
        pxx = int((i - 3) / 4)  # x of sprite
FFT後のデータは鏡像になりますので、ナイキスト周波数まで(256サンプルの半分)の範囲だけを使います。
また、DC成分を除去するため、rangeの開始は1から開始しています。
次に、4サンプルごとの最大値を求め、変数fmax4に格納します。
simpleioを使い、FFTの振幅(0からgain_fまでの値)をスプライトの位置31から0までの範囲にマッピングします。
The data after FFT is a mirror image, so only the range up to the Nyquist frequency (half of 256 samples) will be used.
Also, to remove the DC component, the range is started from 1.
Next, we find the maximum value every 4 samples and store it in the variable fmax4.
By using simpleio, we map the amplitude of the FFT (values from 0 to gain_f) to the range of sprite positions 31 to 0.
        if peak[pxx] > pxy:
            peak[pxx] = pxy  # update the peak Array
        elif peak[pxx] < 30:
            peak[pxx] = peak[pxx] + 2  # move pixels down by 2

        # Clear existing sprites
        if peak[pxx] > 0:
            sprite_hd[pxx, peak[pxx] - 1] = 0
        if peak[pxx] > 1:
            sprite_hd[pxx, peak[pxx] - 2] = 0
        # Place sprites
            sprite_hd[pxx, peak[pxx]] = 15 - int(peak[pxx]/2)
現在の振幅が配列peakに保存されている値よりも大きい(スプライトの座標としては小さい)場合、その値で配列peakを上書きします。
現在の振幅が配列peakに保存されている値以下かつpeakの値が30未満の場合、peakの値に2を足します。これによって、画面上のプロットが下の方に落ちていきます。
If the current amplitude is greater than the value of the ‘peak’ array (= smaller than the coordinates of the sprite), the array ‘peak’ is overwritten by the current value of the peak.
If the current amplitude is less than or equal to the value stored in the ‘peak’ array and the value of the peak is less than 30, add 2 to the value of the peak. This will make the plot on the screen to fall down to the bottom.
画面上のプロットの上側のスプライトを黒のスプライトで上書きして表示を消します。
このあたりはもう少し改善の余地があるかなと思っていますが、とりあえず動きます!
It overrides the sprite at the top of the plot on the screen with a black sprite to turn off the display.
I think there’s a little more room for improvement in this area, but for now, it works!
最後に、配列peakで算出したスプライトの位置にプロットのスプライトを配置します。
Finally, we place the plot sprites at the sprite positions calculated in the array ‘peak’.
終わりに
Closing
いかがだったでしょうか?
C++と比べれば重たいPythonですが、MicroPythonのulabの「一部」がCircuitPythonに移植されたことで、高速にFFTやnumpyライクな処理ができるようになりました。
今後もCircuitPythonを使った工作の例をご紹介していきます。
STEAM Tokyoストアのサポートも是非よろしくおねがいします。
What did you think?
Although Python is heavier than C++, “parts” of MicroPython’s ulab have been ported to CircuitPython and now we can do FFT and numpy-like processing.
We’ll continue to show you the implementations with CircuitPython.